
Email Support Forecasting: A Practical Guide for Small Teams
Email Support Forecasting: A Practical Guide for Small Teams ! Support lead reviewing email workload and staffing Email support forecasting means predicting how many support emails will arrive each day or week, then converting that number into the hours of work your team needs.

Email support forecasting means predicting how many support emails will arrive each day or week, then converting that number into the hours of work your team needs. For a small team, the method is simple: count new conversations from your own history, adjust for seasons and known events, multiply by handle time, and compare the result with the hours you can actually staff. It only works if every conversation lands in one shared, trackable place, which is why we built SendSync as a shared inbox that connects to your existing Gmail or Microsoft 365 mailboxes in minutes.
You do not need a data scientist or a workforce-management suite. You need clean counts, a spreadsheet and a monthly habit of checking the forecast against what really happened.
TL;DR
- Forecast email by day or week, not by 15-minute interval. Email is a non-urgent channel, so daily volume is the usual planning unit.
- Volume = base trend × seasonal index × day-of-week index, adjusted for launches, billing runs, price changes and outages.
- Convert volume to people with workload = volume × average handle time, then divide by the productive hours each person really has after shrinkage.
- Review monthly: compare actuals with forecast, investigate misses above 10%, and update your multipliers.
- Good forecasts start with good data: one shared inbox, consistent tags and no conversations hiding in personal mailboxes.
Table of Contents
- Why email needs its own forecast
- Step 1: Collect the right history
- Step 2: Build the baseline and seasonal pattern
- Step 3: Turn volume into staffing hours
- Step 4: Track accuracy and revise
- Common mistakes to avoid
- Put your forecast on a single shared inbox
- FAQ
- Sources
Why email needs its own forecast
Phone and chat arrive in real time, so planners forecast them in 15- or 30-minute slots. Email behaves differently. Messages pile up overnight and over weekends, and the team drains the queue during working hours. One analysis of ticket data notes that email accumulates overnight while chat spikes during business hours, so each channel should be forecast on its own.
That difference changes what you plan for. With email, the question is not “who is on the phones at 2 p.m.?” but “how many hours of work arrive per day, and can we clear them within our promised response time?”
A good forecast gives a small team four things:
- Predictable response times, because you know which days will be heavy.
- A defensible case for hiring or adding part-time help before the queue gets out of hand.
- Fairer workloads, since nobody is surprised by a Monday flood.
- Fewer all-hands scrambles when a launch or a price change hits.
One vendor’s workforce guide cites a survey finding that forecast accuracy was the top measure affecting team satisfaction. Even on a three-person team, people feel the difference between a planned busy week and an ambush.
Step 1: Collect the right history
A forecast is only as good as the history behind it. Gather these three things:
- Volume by day and by channel. One professional guide recommends at least two years of contact volume by interval and channel. Another suggests 12 to 24 months of ticket and email history. If you are younger than that, use what you have: even 8 to 12 weeks of ticket counts organized by day, category and day of week is a workable start.
- Handle time. How long does the average conversation take to resolve, counting every reply? Workload is contact volume multiplied by average handle time.
- An event log. Write down the date, what happened and roughly what it did to volume: outages, botched email sends, pricing changes, launches. The same guide says that cleaning known anomalies out of history is often worth more accuracy than upgrading the model.
Count conversations, not messages
A thread with eight replies is one customer need, not eight. A team-email metrics guide advises counting new threads per day rather than total messages, and breaking volume down by hour, day, category and top senders. It also points out that a single demanding client can account for 30% of volume, which is worth knowing before you extrapolate.
The same discipline applies to “resolved” counts. Closed tickets tell you what you cleared, not what arrived. Forecast arrivals, and track backlog separately.
Where this data comes from
If your support email is scattered across personal inboxes and forwarded threads, you cannot count it reliably. In a shared inbox, every conversation has one record, an owner and a status. In SendSync you can tag conversations by type, save views for each category and read your numbers in the metrics dashboards, so the history is collected as a side effect of doing the work. Our guide to support inbox organization covers a tagging scheme that keeps categories consistent enough to forecast from.
Step 2: Build the baseline and seasonal pattern
The standard formula is: forecast volume = base trend × seasonal index × day-of-week index × intraday distribution, adjusted for known events. For email, you can usually drop the intraday piece and work in days.
Base trend
Start with growth. One guide’s example: if volume grew 15% year over year, apply 15% to the historical number to get a baseline. It is crude, and it is a fine first pass for a small team.
Seasonal multiplier
Overlay two to three years of volume on a single calendar and mark the weeks that are consistently 20 to 50% above or below average. A 100-ticket average week with 180 tickets in November gives a multiplier of 1.8. If you have only one year, treat the multiplier as provisional and revise it after the next peak.
Day-of-week index
Email often has a stable weekly shape. A decomposition example in one analysis shows Mondays 35% above average and Fridays 20% below, and calls that a permanent staffing pattern to build into schedules. Calculate your own: divide each weekday’s average by the overall daily average.
Events and launches

History cannot see the future. A workforce-planning specialist stresses that business intelligence about why the future will differ from the past, such as campaigns, launches and policy changes, must be layered onto the forecast. Email arrivals also cluster around external triggers such as billing cycles and media events.
One small-team guide offers rough starting multipliers for event weeks:
| Event | Typical multiplier |
|---|---|
| Minor product update | 1.2 to 1.5x |
| Major feature release | 2 to 3x |
| Promotional sale | 1.5 to 2.5x |
| Black Friday or major holiday | 3 to 5x |
| Price increase | 1.5 to 2x |
| Outage | 3 to 10x |
Those figures come from a published small-team guide, not from a universal law. Treat them as a starting point, then replace them with your own after each event. This is where your event log pays off: after a launch, write down what the multiplier really was.
Do not forget re-contacts
Every new case produces follow-ups. One planner estimates 0.5 to 2.5 additional touches per new case. If your customers often reply with “still not working,” your effective workload is higher than your new-thread count suggests. Track the ratio of replies to new threads and fold it into handle time.
Step 3: Turn volume into staffing hours
Here the forecast becomes a plan. The bridge formula from one guide is: forecast volume × handle time in hours ÷ (target hours per person × (1 − shrinkage)) = people needed. Shrinkage is the share of paid time not spent on customer work: meetings, breaks, training, time off.
A purpose-built email method is slightly different. It computes hours of work as volume ÷ (productivity × (1 − shrinkage)), where productivity is cases solved per hour. One planner says email productivity is usually 65 to 80% of paid hours and should come from your own history.
A worked example
Imagine a hypothetical startup with these numbers:
- Average week: 400 new conversations.
- Average handle time: 6 minutes (0.1 hours), including follow-ups.
- Each person works 40 hours a week with 30% shrinkage, so 28 productive hours.
Normal week: 400 × 0.1 = 40 hours of work. 40 ÷ 28 = about 1.4 people.
November with a 1.8 seasonal multiplier: 720 conversations × 0.1 = 72 hours. 72 ÷ 28 = about 2.6 people.
The gap is more than one full person, and you can see it months in advance. That is the difference between hiring a part-timer in September and apologizing to customers in November.
Plan the backlog separately
Today’s capacity is today’s arrivals plus yesterday’s carryover. Weekend email builds a queue that has to be drained on weekdays, and the opening queue should be treated as an input to staffing calculations. If you already have a pile, our 30-day plan to clear a support email backlog shows how to bring it to zero before you forecast from a clean start.
Set a response-time target you can staff
Email service levels are expressed as elapsed time, for example 80% of emails answered within 4 hours. One US glossary reports the buyer market has settled on 12 to 24 hours for a first email response, with the best teams answering inside 4 hours. Pick a target, then size the team to it. If you also answer customers on social channels, these response time standards for small businesses help you keep targets consistent across channels. A tighter target needs more capacity at the same volume, so the forecast and the promise must be set together.
Two practical notes for small teams:
- If you cover time zones or evenings, build that into the schedule. Our guide to after-hours email support for small teams shows how to do it without burning people out.
- When volume spikes, routing matters as much as headcount. Queue-based routing sends each type of request to the right person, and an escalation workflow keeps urgent cases from sitting in the pile.
Step 4: Track accuracy and revise
A forecast you never check is a guess with a spreadsheet around it. A simple monthly loop, adapted from one guide’s process:
- Compare actual volume with the forecast.
- Calculate error as (actuals − forecast) ÷ forecast.
- Investigate any miss above 10%: was it an unlogged event, a bad multiplier or real growth?
- Add the month to your history, and update seasonal multipliers and event adjustments.
- Rerun the staffing formula and flag any hiring gap.
Between monthly reviews, set a trigger for an early reforecast. One revision framework suggests an out-of-cycle update when actual volume exceeds the forecast by more than a defined percentage, such as 20%, for consecutive periods, or when a known event’s impact can finally be measured. It also suggests keeping a version history that records the baseline, each revision with its trigger and who made it, and the final committed forecast. A small team can do that in a single tab of the same spreadsheet.
For stable weekly patterns, Holt-Winters exponential smoothing with additive seasonality is one method said to work well, while event-driven spikes need manual overlays. Most small teams will get further with the multipliers above than with a statistical model, and a spreadsheet’s built-in forecast function can add the smoothing if you want it later.
Common mistakes to avoid
- Forecasting messages instead of conversations. It inflates volume and hides the real workload.
- Ignoring planned events. Launches, billing runs and price changes are the most predictable spikes you will ever get.
- Using one number for all channels. Email, chat and social follow different rhythms.
- Assuming 100% productive time. Without shrinkage, every staffing number comes out too low.
- Never updating multipliers. Your first seasonal index is a draft. The second year makes it reliable.
- Splitting history across mailboxes. If half of your support email sits in personal inboxes, your counts will be wrong by an unknown amount.
What we have learned about forecasting email support
Most forecasting advice is written for call centers with hundreds of agents. Small teams run into a different problem first: they cannot forecast what they cannot count. When support email lives in several personal inboxes, nobody knows true volume, who owns what or how long anything waits.
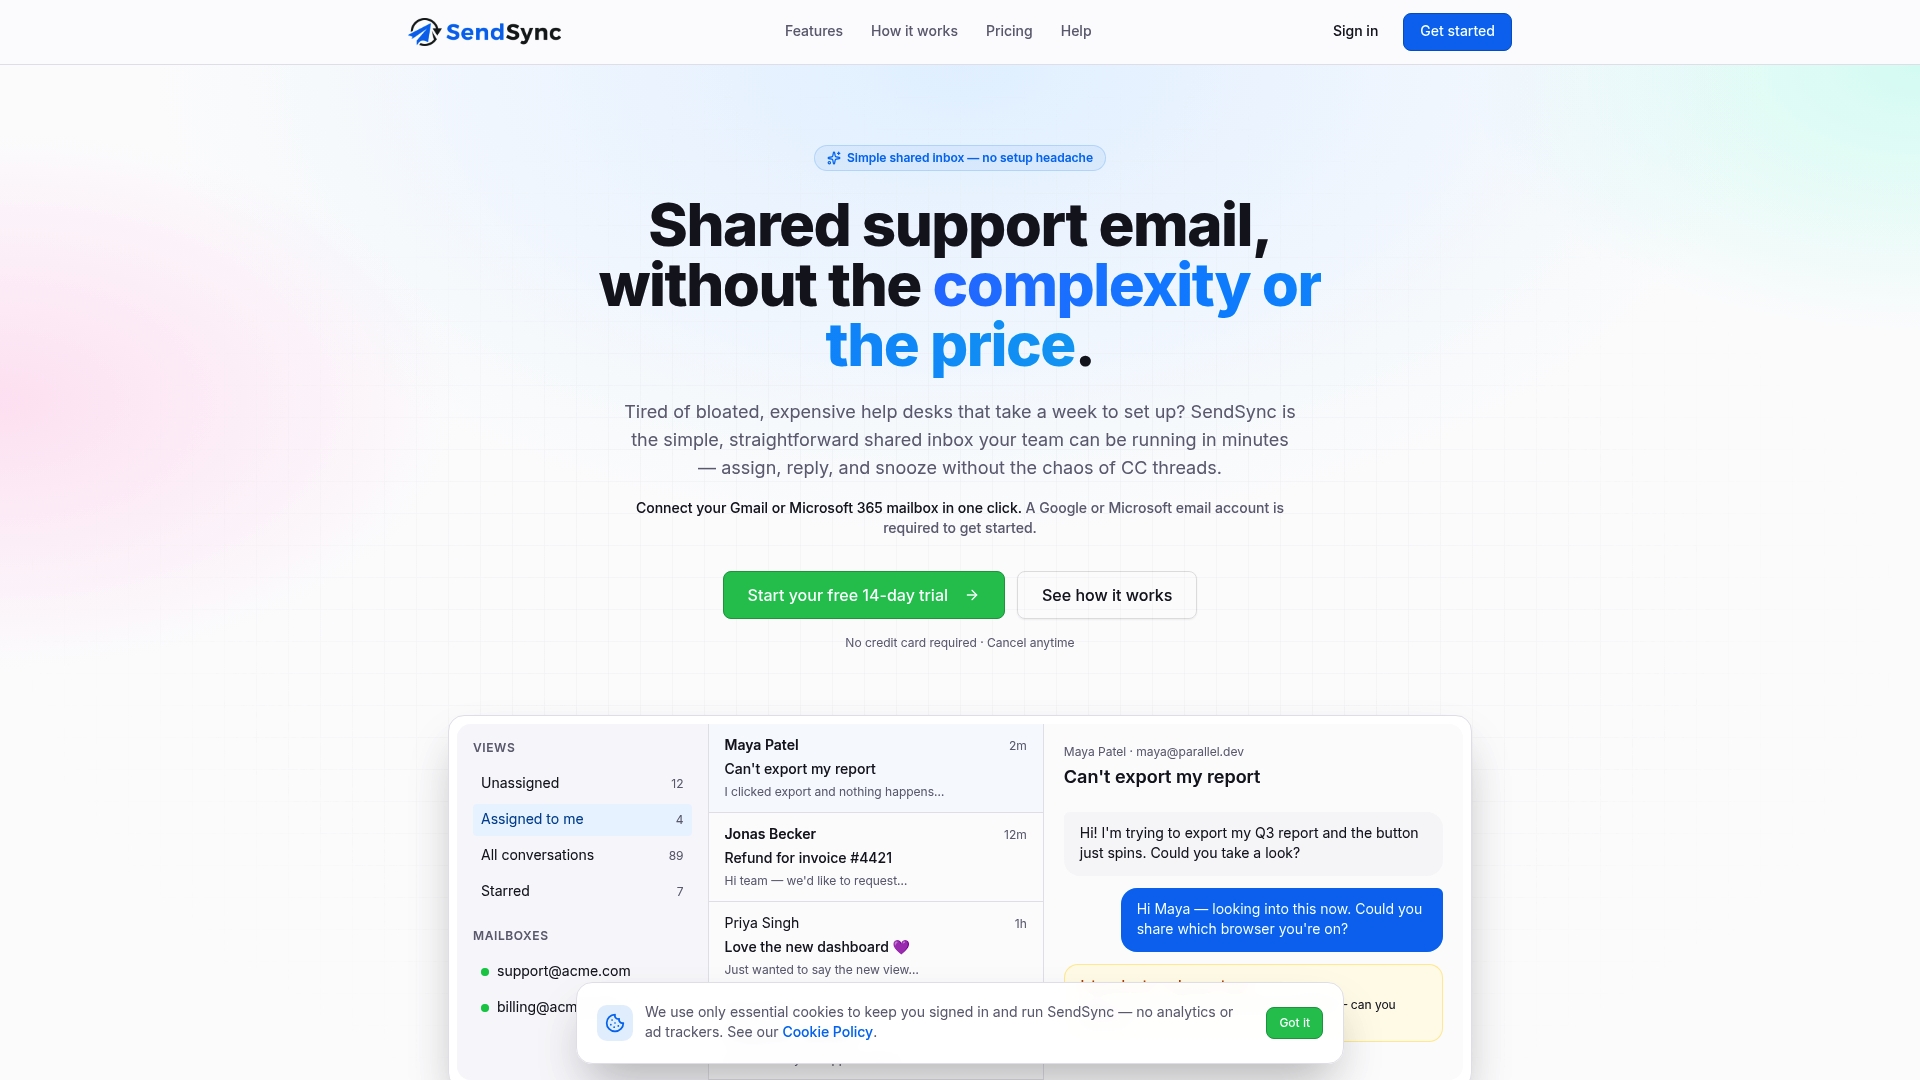
That is why we built SendSync as a razor-thin shared inbox. It connects to Gmail or Microsoft 365 with no DNS setup, so you are live in minutes, and every conversation gets an owner, tags and a status. Internal notes keep context on the thread, and saved views and metrics dashboards give you the history a forecast needs.
We also think forecasting should not be priced per seat. Plans have unlimited users, so adding a part-timer for the November peak does not change your bill. Count conversations, log your events, check your error monthly, and keep the tooling simple.
Nick
Put your forecast on a single shared inbox
If you are ready to stop guessing, SendSync gives your team one place for every support conversation, with unlimited users and no per-seat fees. Plans are Founder at $10 per month, Starter at $30, Growth at $80 and Scale at $200, and you can start with a 14-day free trial.
If you are still deciding how to organize work across the team, our guide to running email support as a team is a good next step. For distributed teams, how an asynchronous inbox works explains how to keep hand-offs clean.
FAQ
How much history do I need to forecast email support?
Two years of volume by channel is the usual recommendation, because it lets you see seasonality twice. If you have less, start with 8 to 12 weeks of daily counts, apply your known events and refine as the data grows. Even a rough first forecast beats none, as long as you review the error monthly.
Should I forecast email by hour or by day?
By day, or by week for headcount planning. Email is non-urgent, so hourly or 15-minute intervals matter mainly for chat and phone. Use the day-of-week pattern to decide who is on the queue on heavy days.
How do I convert forecast volume into the number of people I need?
Multiply forecast conversations by average handle time to get hours of work. Then divide by the productive hours each person has after shrinkage. In the example above, 720 conversations at 6 minutes each need 72 hours, which is about 2.6 people at 28 productive hours each.
How often should I update the forecast?
Review it monthly, and reforecast early if actual volume runs well above the forecast, for example 20% over for several days in a row. Also revise after any launch, outage or price change once you can measure its impact.
Sources
- How to Build a Workforce Forecasting Process
- Call Center Forecasting methods, formulas and tools
- How to Forecast Customer Service Demand
- Contact center forecasting fundamentals part 1
- Email Productivity Metrics For Teams (2026 Guide)
- Support Volume Forecasting: Predict Ticket Spikes for Small Teams
- Support Ticket Volume Forecasting
- Demand Forecasting for Digital and Async Channels
- Reforecast and Rolling Forecast Methodology
- Staffing requirements for email and back office
- Planning for emails
- Email Support glossary
- Social Media Response Time Standards for Small Businesses